Get in touch with QJKH Company
A volume measurement LiDAR scanner measures the volume of a stockpile, silo or conveyor load by firing laser pulses at its surface, creating a 3D point cloud and then integrating the shape above a base plane. Done correctly, lidar has 1-3% volumetric accuracy on bulk material – even under coal, iron ore and asphalt where optical methods fail. This document unpacks how accurate volume measurement actually works, how LiDAR compares to photogrammetry and radar, where the latent error terms in measurement accuracy lurk and what sensor specifications turn a production-grade instrument into a consumer hobbyist scanner.
Quick Specs – what a volume measurement LiDAR must deliver
- Angular resolution of 0.1°-0.3° – finer angular spacing yields more points per m² of pile surface.
- Range repeatability ≤4 mm at 1σ against ≤10% reflective surfaces
- Scan range ranging between 15 m and 40 m depending on pile size and sensor standoff.
- Interface over Ethernet UDP for real-time point-cloud streaming.
- Environmental rating of IP65, 100,000 lux ambient-light rejection, -10 to +50 °C.
- Measurement principle: direct time-of-flight (dToF), 905 nm class.
What Is a Volume Measurement LiDAR Scanner?

A volume measurement LiDAR scanner is a fixed or mobile sensor that fires laser pulses at a surface – typically a pile of bulk material, the contents of a silo or a conveyor belt – and creates a three-dimensional point cloud from the returns. Software then processes that point cloud into a surface model and the volume integrated over a pre-defined base plane. This is a non-contact process; the data collected by the sensor works in the dark and survives dusty environments far better than any optical camera.
It is important to separate a volume measurement LiDAR from the position measurement LiDAR used on AGVs and AMRs. They range on the same principle, but they tune for different factors. Navigation LiDAR wants a high scan speed so an AMR can avoid obstacles in a 50 Hz feedback loop. Volume measurement LiDAR fields less importance on high scan speed – as the pile is static, not moving – and much more on angular resolution, intensity measurement range and range accuracy because every millimeter of range error propagates to cubic meters of volume error over a large surface.
Industries which use lidar technology for volume measurement are the ones where inventory accuracy is a financial metric. Mines measure iron ore, coal and aggregate piles worth millions a day. Cement works inoculate limestone and clinker into kilns. Grain elevators need continual silo levels for logistics. Ports measure truck-load volumes at drive-through gates. In each case, a LiDAR sensor replaces tape-and-GPS surveys that took hours, with a reading that takes seconds to display.
How LiDAR Volume Calculation Works — From Pulse to Point Cloud to Cubic Metres
Every calculation starts with a single laser pulse and ends with a number in cubic metres used to calculate the volume of the target. There are four stages between those two points, and the accuracy of each stage cubifies into the final error.
How Does LiDAR Calculate Volume?
Three steps. Scan. Mesh. Integrate above a reference plane.
Stage 1 – Ranging. Laser pulse in the 905 nm near infrared band is emitted by the instrument, then it transmits the time until the reflection pulse is received. That direct time-of-flight measurement (dToF) provides a single range value per angular resolution. A scanner operating at 0.1° horizontally across a 270 field of view provides 2,700 range samples in every revolution.
Stage ². Point cloud generation. Each individual range measurement is transformed to a 3D point by applying the known angular position of the sensor. With the sensor rotating on a single axis this results in a 2D slice. To generate a 3D laser point cloud of a pile, that slice must be swept through space – either by rotating the sensor on a second axis, by translating the sensor on a vehicle or gantry, or by combining readings from several fixed sensors viewing the pile from different angles. High-quality installations generate densities between 100 and 1,000 points per m² on the pile surface. Visualization of point-clouds in software such as CloudCompare or QGIS allows confirmation of coverage prior to the pile coming into service.
Stage 3. Surface generation. Raw data points are blended into a continuously varying surface model using a triangulation (Delaunay triangulation being the most common) or a voxel grid. Preprocessing typically filters out noise from dust and stray returns.
Stage 4. Volume calculation. That surface is referenced to a plane above which the volume can be integrated. As with any simple stockpile, MathWorks and most commercial software package deliver this as a single function which takes as input the point cloud and the base polygon and outputs a single number in m³. Volume of material in successive scans may be converted to tons using the bulk density of the material.
Key point: ranging precision limits the floor on volume error. Surface density and Triangulation quality determine how close to that floor you can actually get.
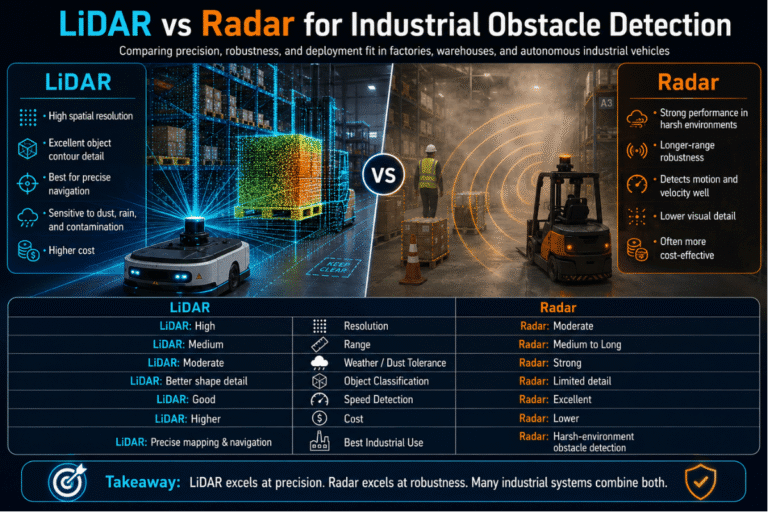
LiDAR vs Photogrammetry, Ultrasonic, and Radar — Which Volume Sensor Wins?
Choosing a measurement technology for volume measurement is not always straightforward. All measurement methods have effective regimes and ineffective regimes. Our selection matrix below uses the five most important factors to a buyer – achievable accuracy, appearance on dark or diffuse surfaces, perceived weather and dust robustness, average hardware cost per sensor, and application space – to compare four candidates.
| Technology | Typical volume error | Dark / uniform surface | Dust and weather | CAPEX per sensor | Best fit |
|---|---|---|---|---|---|
| 2D LiDAR (fixed) | ±1–3% | Excellent (to ~10% reflectivity) | High | $2,500–$8,000 | Conveyor, silo, fixed stockpile |
| 3D drone LiDAR | ±1–3% | Excellent | Medium (not in rain) | $40,000–$1²0,000 | Large outdoor stockpiles |
| Drone photogrammetry | ±3–8% | Poor on uniform dark surfaces | Low (needs daylight) | $3,000–$15,000 | Textured small piles in daylight |
| Ultrasonic level sensor | ±3–10% on volume | OK but angle-limited | Medium | $500–$2,500 | Silo level, single-point |
| Radar (FMCW) | ±5–15% on volume | Excellent through dust | Very high | $3,000–$10,000 | Blast-furnace bins, opaque dust |
Is LiDAR More Accurate Than Photogrammetry for Stockpiles?
Photogrammetry can equal a LiDAR survey of a well-textured, well-lit stockpile to within 1-2% volumetric error. Issues begin when the surface stops being textured. Video-stitched photographs determine shape by recognizing specific tie points in multiple different observations, and a glossy dark surface – coal, wet gravel, asphalt – simply has too few visual features for the matcher to recognize. A 2025 review of dark-tone materials suitable for LiDAR detection in Advanced Functional Materials confirmed that 905 nm LiDAR sensors already cannot range against absorbent surfaces with near-IR reflection profiles like photogrammetry requires; in such an environment, LiDAR can improve its ranging success rate and image quality by absorbing additional photons, but photogrammetric image data simply no longer exists.
Field reports from the Indiana DOT Salt Monitoring and Reporting Technology (SMART) project, published through Purdue Joint Transportation Research Program, showed LiDAR to be capable of determining volume to within 1-3% of indicated values – a measurement made during production in a dark, enclosed dome with very low contrast, where photogrammetry could merely grasp at a fuzzy outline.
Both LiDAR and photogrammetry can deliver cm-class stockpile accuracy if done right. Tie-breakers here are site conditions: open, well-lit, well-textured sites favour photogrammetry; vegetated, shaded or topographically-complex terrain where good ground edge detection and vertical resolution counts most is LiDAR terrain.
Common pitfall. Buyers often treat photogrammetry as “the cheaper LiDAR” and specify it for coal or iron ore sites because they see the hardware invoice is smaller. Hardware cost is cheaper. Data produced often is not – failed tie-point matches require undocking and reshooting, and the reports are never of the same audit standard as a LIDAR scan validated against a ISO 17123-9 field procedure. For dark materials always start with the sensor you can physically see them with, then decide whether you also want texture. The other way around costs more.
Applications — Stockpiles, Silos, Conveyor Belts, and Truck-Load Volumetrics
The four application families below make up the vast majority of industrial volume-measurement LiDAR deployments. Each has different requirements for range, resolution, and mounting geometry.
Stockpile monitoring — coal, aggregate, iron ore
One coal-handling yard at a mid-west Australian port installed six fixed LiDAR scanning units across the western and eastern bays of its storage shed to monitor the volume and tonnage of raw mining materials in real time. These sensors feed a control system that calculates volume change between shifts, eliminating the need for staff climbing the piles with GPS rovers. Gains include labour hours, but also the fall and dust-inhalation hazards associated with walking a coal stockpile. Reclaimer-mounted LiDAR on bucket-wheel excavators serves the same purpose during operation, giving the plant a constantly-updated stockpile inventory without any human risk.
Conveyor-belt flow rate
On a flat belt, a 2D LiDAR mounted above the belt captures a cross-sectional profile of the material at a fixed frequency – typically 20 to 50Hz. Each profile, multiplied by belt speed (taken from a rotary encoder) yields an instantaneous volumetric flow rate. Integrate the flow rate over an hour and you’ve got the tonnages delivered. This is the architecture behind Pepperl+Fuchs’ Volume3D sensor and the conveyor belt volume scanners offered by other industrial vendors. Belt speed synchronisation is the single largest source of error: 1% error in belt speed measurement equates to 1% error in tonnages, regardless of how good your LiDAR sensor is.
Silo and bunker level
Fixed LiDAR scans downward from the top of a silo, sweeping the surface of the stored material. Dust is the primary obstacle – a grain silo when filling can reach optical densities where a camera is useless. Pulse averaging combined with a wiper or airblast on the optical window preserves usable returns during most of the dust event. Grain silos with reflective walls can create spurious returns so zone filtering at installation time is important.
Truck-load drive-through volumetrics
Two LiDAR sensors mounted above and beside a truck lane profile each truck as it passes through at 5-10 km/h. Each system compares the loaded profile with an empty reference and delivers a load volume in less than five seconds. Mines and aggregate quarries use this to verify contractor payloads against invoices – payback on a single disputed load often covers the cost of a LiDAR sensor.
Accuracy Budget — How Resolution, Repeatability, and Reflectivity Set Final Volume Error
The datasheet headline parameters are not the parameters which cause the overriding real error in a volume figure. Here is the accuracy-budget formula we suggest buyers use when assessing sensors from all manufacturers.
Engineering Note — The Accuracy Budget Formula
Total volume error = ( sqrt( (surface sampling error)² + (range repeatability × point count)² + (edge mesh error)² ) )
For a 30 m by 20 m by 5 m stockpile (3,000 m³) acquired with a sensor at 0.1° angular resolution and 20 m standoff, lateral point spacing is on the order of 35 mm. Range repeatability of 4 mm at 1σ contributes less than 0.2% of total error. Likely dominate term is now surface sampling—how well does the discrete point cloud approximate the true shape of the pile between scan lines?
Capabilities found in actuated-LiDAR work show historic shape errors at 4.4% on a reconstructed pile (Aerospace 2025) driven by mesh outliers more than range accuracy.
Three parameters therefore carry the weight:
- The angular resolution defines the lateral point spacing: at 20 m 0.1° gives about 35 mm, 0.3° gives about 105 mm. For a 1% volume it is best to aim for ≥1 point per 50 cm² (200 points per m²) on a typical stockpile (1% volume) and tighter tolerances would want ≥1 point per cm² (10,000 points per m²).
- Range repeatability defines the noise floor at each point. Headline values such as ±2 cm accuracy are not the same thing as 4 mm repeatability – accuracy is bias,repeatability is jitter. For averaging to work(and it does on stationary piles) repeatability is what counts.Ask for the figure measured at the lowest reflectivity your supplier will quote.
- Range of reflectivity tests is the worst-case. If a sensor gives 4 mm at 1σ against 10% black velvet fabric then it can be expected to cope with coal, asphalt and iron ore but anything that performs only at 70% reflectivity (plain printer-paper grey) you should not trust for dark materials – which are what real bulk-handling sites typically deal with.
The ASCE Journal of Surveying Engineering and the formal ISO 17123-9 field procedure for assessing terrestrially laser scanners against a control geometry. That operation is neither straightforward nor inexpensive, but when a vendor’s marketing number seems too good to be true, it’s the definitive technology.
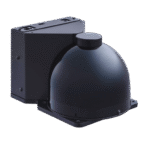
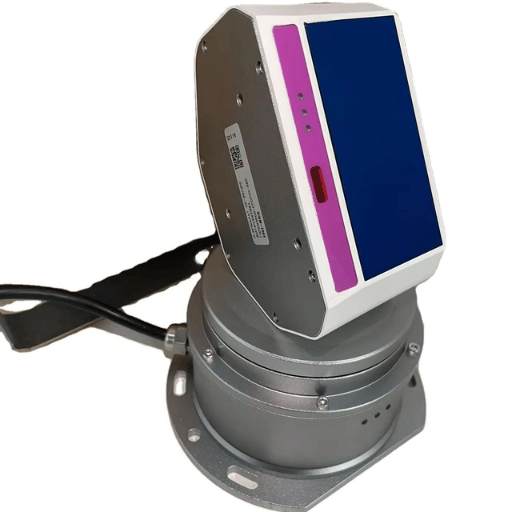
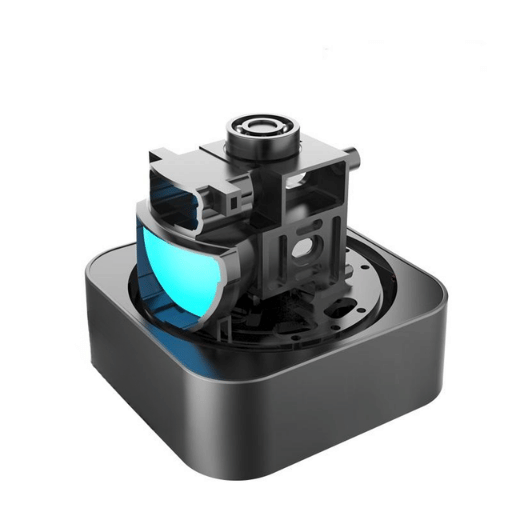
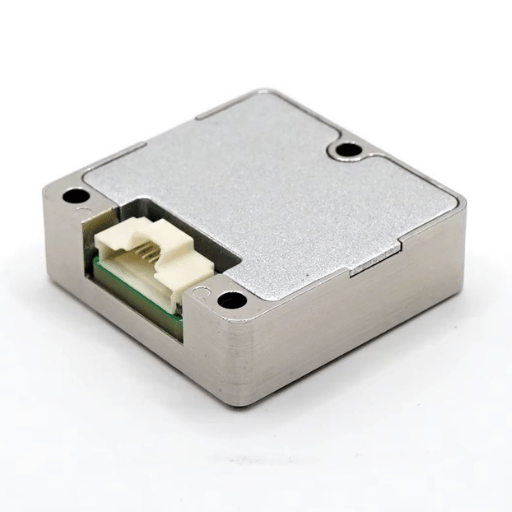
Specifying a Volume Measurement LiDAR — What the QJKH YB27 Measurement Variants Deliver
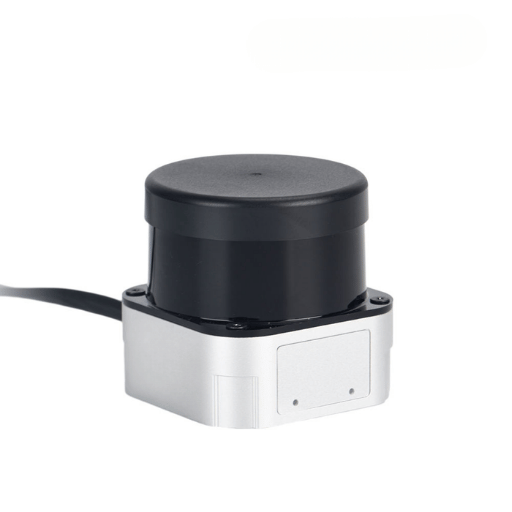
QJKH’s YB27 measurement family is placed at the above fixed-LiDAR position of the decision matrix. These Ethernet UDP scanners are designed for industrial automation, warehousing and intelligent material handling, adopting the same direct time-of-flight ranging principle used across the YB27 positioning line.
Can a LiDAR Scanner Actually Measure Dark Materials Like Coal?
Yes – if the datasheet picks the right key metric. QJKH YB27 measurement variants list a repeatability of 4 mm at 1σ measured over a blanket of 10% black velvet fabric at 600 mm range. That 10% number is the curious point. Coal, fresh asphalt, bitumen and iron ore fines all live in the 8-12% near-infrared reflectivity band in the 905 nm window, so an instrument validated at 10% to a velour target (which is actually more physically demanding than coal, since velvet grabs scattered light) is an extreme use-case from a genuine bulk material surface. Customers who will accept repeatability reports at 70% or 90% reflectivity test the sensor against white office paper, not actual bulk.
Ask three! (1.) At what reflectivity was the repeatability tested? (2.) At what ranging distance? (3.) Was the figure derived from multiple measurements and averaged, or is it a single-measurement snapshot? If any answer is blank, move on to the next supplier. Dark sample reflectance is the only one-shot figure you cannot encode as a software correction after the fact.
| Model | Range | Angular resolution | Scan rate | Best fit application |
|---|---|---|---|---|
| YB27-15CE | 15 m | 0.15° @ 20 Hz | 20 Hz | Compact silo, indoor bunker, small bin |
| YB27-25CE | 25 m | 0.15° @ 20 Hz | 20 Hz | Mid-size conveyor, warehouse stockpile |
| YB27-25HE | 25 m | 0.1° @ 25 Hz | 25 Hz | High-density scan of fine aggregate |
| YB27-35HE | 35 m | 0.1° @ 25 Hz | 25 Hz, adaptive | Outdoor stockpile 20–35 m radius |
| YB27-40HE | 40 m | 0.2° @ 50 Hz max | 50 Hz | Truck-load drive-through, large reclaimer |
Two reasonably frank points to be made on this subject are: The YB27 is a 2D single-line ranging LIDAR. For stockpile inventories with a full 3D digital map you have to take advantage of this fact by either (a) putting the probe on a turntable to rotate between scans, (b) mounting the sensor on a trolley or spider gantry with the motion tracked, or (c) siting multiple fixed-sensors whose slices add up. In a fixed installation a 2D scanner is an slice of a solid, not the entire solid. Every sane installation diagram in the literature for fixed-LiDAR measuring of stockpiles visualises sensor and motion source as a duo.
Second point, all environmental specs – IP65, -10 to +50 °Celsius, 100,000 Lux rejection – assume the glazing stays spotless. In thermal stations and cement yards any sensor that needs no wiper or air-purge accessory is a stick for the maintenance crew, not an easy-to-replace probe. Build the accessory into the price. Request the full YB27 measurement-variant datasheet before committing to a range class.
Selection Checklist — Five Questions Before You Buy
Lastly, here is the set of five questions the QJKH design team asks customer before quoting:
- What is the most reflective bulk that the instrument will measure? Demand the repeatability at that reflectance in writing. QJKH sensors asked to scan 70% shows you nearly nothing about how they behave when faced with coal.
- What is the maximum instrument surface standoff? Add twenty percent to the bad-case situation and buy the range class stored one size higher. Running a 25 m setup on a 25 m sensor leaves you no margin in case the measurement is offset.
- What is the reporting period? For real-time dashboards when less than five seconds you will need Ethernet UDP ports, hourly inventory measurement can be done with a serial link. Pick the interface that matches the pulse to figure rate.
- Will the sensor be capturing dust, rain or direct sunlight? Answer Yes to 100,000 lux ambient rejection if outdoors, IP65 or higher if dusty, and probably set aside a wiper or air-purge accessory on all coal, cement or grain jobs.
- Are you after a single volume value or a flow rate? Static volumes only require the sensor and a reference plane. Flow rates require a synchronised encoder on the conveyor or a timestamped point-cloud pipeline to correctly integrate motion.
Answer those five honestly and the specification narrows itself.
Request a YB27 Measurement Datasheet
Full specs, a 10% reflectivity test report and a free evaluation sample on the majority of industrial projects.
Frequently Asked Questions

How accurate is LiDAR volume measurement?
View Answer
The existing production systems reliably reach 1-3% volumetric error. A single Indiana DOT controlled salt-dome survey reported just 0.1% against a traditional reference survey. Each of point density, mesh quality and the bulk-density conversion from m³ to tonnes adds its own small contribution.
What LiDAR point density is enough for accurate volumes?
View Answer
A good general guide is 1 point per 50 cm² on a pile surface for 1% volumetric accuracy, and 1 point per cm² for 0.5%. Point density is a product of angular resolution, standoff and how much of the pile the unit’s field of view actually sees. Always verify density on the first installed scan – real world occlusion will be less for giving than the questionnaire.
Do LiDAR sensors work in dusty environments?
View Answer
Yes, on a wiper or air purge in front of the window.
LiDAR vs drone photogrammetry — which wins for daily stockpile tracking?
View Answer
For open, well-lit, features-rich piles, photogrammetry from a mobile photogrammetric platform can match LiDAR at a fraction of the hardware cost. For 24/7, unattended, continuous monitoring – especially on dark stockpiles like iron ore or coal – a dedicated LiDAR beats every thing: it works in the dark, it does not need a pilot, and it can scale across whole chains without new flights.
How much does a volume measurement LiDAR scanner cost?
View Answer
Individual fixed 2D LiDAR scanners for volume measurement typically list between US$2,500 and $8,000 depending on range class, output interfaces and angular resolution. Integrated turnkey stockpile monitoring – scanner plus enclosure, wiper, controller and API software – will cost another $5,000 to $15,000 per installed point. Drone LiDAR payloads begin at $40,000.
Can a 2D LiDAR really measure a 3D volume?
View Answer
A single fixed 2D LiDAR provides only a single scan plane: A slice of the pile, not a volume. In practice, the third dimension arrives either through motion, beam by beam. There are three main ways to implement this motion. The first is a gantry or vehicle-mounted unit with GPS/INS, milling the pile between continuously tracked scans. The second is a pan-tilt scanner that compiles fixed-LiDAR slices from different angles, while the third is multiple fixed LiDARs paired with a registration algorithm that ‘fuses’ the individual slices into a full volume. Regardless of approach, remember that it is never the LiDAR alone providing accurate results; the motion source is just as important as the sensor.
References & Sources
- Salt Monitoring and Reporting Technology (SMART) – Purdue Joint Transportation Research Program (JTRP-2021/11), Indiana DOT
- ISO 17123-9 – Field procedures for testing terrestrial laser scanners – International Organization for Standardization
- Actuated and Single-Drone Systems with 1D LiDAR Sensors for Stockpile Measurement – Aerospace, 2025, Harvard Astrophysics Data System
- Designing LiDAR-Detectable Dark-Tone Materials with High Near-Infrared Reflectivity – Advanced Functional Materials, Wiley
- Granular Stockpile Volume Dataset – PubMed Central, U.S. National Institutes of Health
- Evaluation of a Terrestrial Laser Scanner According to the ISO 17123-9 Standard – ASCE Journal of Surveying Engineering
- Salt Stockpile Inventory Management Using LiDAR Volumetric Measurements – Remote Sensing, 2022, Harvard Astrophysics Data System
Related Articles
- Positioning LiDAR for AGV and AMR Navigation – The YB27 Family Explained
- Safety Laser Scanner vs 2D LiDAR for Industrial AGV (coming soon)
- 2D vs 3D LiDAR for Industrial Sensing – When to Move Up (coming soon)
- Industrial LiDAR Specification Checklist – A Buyer’s Field Guide (coming soon)
A word on this article. Cited accuracy figures originate from peer reviewed and standards guild sources, and sensor specs cited for the QJKH YB27 family originate from first-party product documentation dated 2026. Actual volumetric accuracies depend on the installation geometry, point cloud density on the actual pile, and the bulk density used to convert from m³ to tons. This article was assembled by the QJKH engineering team and verified against current product datasheets prior to publishing.